Published as poster at the Nanotech Europe 2009 conference & exhibition in Berlin, 28th – 30th of September at the Technical University in Berlin
by Dr. Hanno Wachernig, Particle Metrix GmbH, www.particle-metrix.de
Introduction
Ionic end groups at the interfaces of molecules or particles prevent Van der Waals attraction, a short range force causing coating of surfaces, coagulation, aggregation, flocculation and coalescence of colloids and dispersions. The higher the electrostatic repulsion between particles, the lower is the probability for collisions of Van der Waals type. A great amount of formulation work is directed to the optimization nof particle interfaces for dispersion stability and good dispersability. One part of it is the control of the electrokinetic behavior of the dispersions and macromolecular solutions.
The presented ZetaView® revives the direct measurement offered by a micro – electrophoresis set-up to a new attraction. Laser illumination, auto-alignment, direct visualization and tracking of the moving particles by video analysis are the tools to achieve this.
Electrophoresis set-up

A colloid dispersion is placed in an electric field. Charged particles move to the opposite electrode. Their velocity indicates the amount of charge at the particle interface. By dividing the measured velocity with the electric field strength and taking into account ε and η, zeta potential ζ can be calculated from the measured electrophoretic mobility µe.
Zeta potential can be seen as contributing to the potential energy q*ζ, when a charge q is placed at the “slipping plane” at approx. the Debye length away form the particle interface. Depending on the polarity of involved charges, the energy is of repulsive or attractive nature. The zeta potential of particles, immersed in a medium of defined pH and ionic strength, may indicate the expected stability of such a dispersion. It depends on whether other stabilization mechanisms like steric repulsion play a role in the system.
The lay-out of the ZetaView® and a typical result

A laser beam is illuminating the focus plane of the microscope objective. Both axes are at 90° to each other and kept in coin-cidence via an automated tracking. The scattered light from the particles is projected to a 30 frames per second delivering video camera. Because of the scattering principle the instrument is not diffraction limited. Only background light limits the size to 80 nm.
With an acquisition and analysis software, the movement of each individual particle is tracked, Brownian as well as electrophoretic motion. From the Brownian motion at zero applied field the diffusion coefficient and - via Stokes Einstein formula - the size distribution are derived. The tracking of typically a few thousand particles delivers the mobility / zeta potential distribution, which guaran-tees a good repeatability and resolution in broad electro-phoretic distributions. The result on the left during a kinetic experiment demonstrates this.
Absolute and discriminating method
All measurement parameters of the instrument like camera pixel distance, time duration, electrode distance, auxiliary voltage, temperature of the sample, can be calibrated. Therefore no zeta potential reference material is needed for calibration.
The lowest measurable size at present is 80 nm (latex), the highest is 50 µm, as long as the particle stays in the image. Typically, flocks and fibers do that, at least during the experiment duration of a minute or shorter. Because each particle in the focus field of 300 x 240 x 20 µm is seen, differences in shape like droplets and irregular particles (as fat & casein in milk) or like primary or agglomerated particles can be differentiated and measured either individually or all together. The result is a highly resolved zeta potential histogram as shown above.
The above example shows one shot during the kinetics after an anionic and a cationic pigment were mixed. A negative and a positive peak were present shortly after mixing of the 2 pigment components. The one was at –11 mV, the other at +48 mV. After 30 minutes, the negative peak completely disappeared. It was “absorbed” by the positive pigment component, staying at +45 mV. In the middle of the kinetics a tri-modal appeared, as shown in the above zeta potential distribution curve. Generally speaking, in a mixed system, individual zeta potential peaks, which are present at the beginning of the experiment, may move – as above - or not move towards each other. This depends totally from the ion exchange activity of the participating partners of a dispersion.
Unique zeta potential results from “seeing is believing”
Astonishingly, in most observed cases, primary particles and agglomerates of them, move at the same electrophoretic velocity. This might be explained by the fact, that there is always some probability for a Van der Waals agglomeration, at high zeta potential less and at low zeta potential more. Such a collision should in principle not change the charge characteristic of the particles forming the agglomerate and hence, the zeta potential of the agglomerate is the same as the zeta potential of its components.
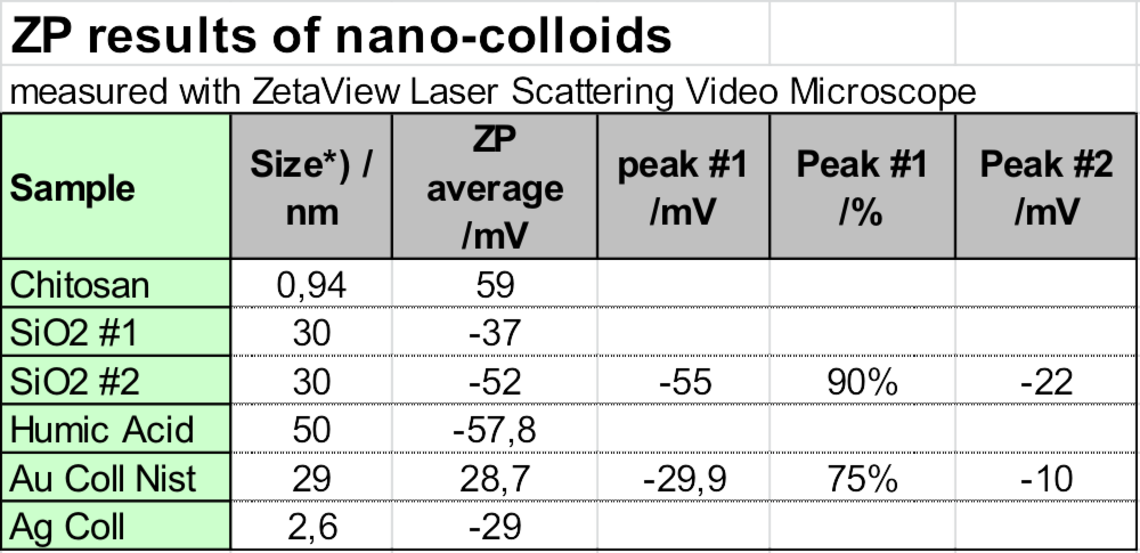
This fact can be used to conclude from the zeta potential result of agglomerates to the zeta potential of the very small particles, which cannot be directly observed. As the following table shows, the size of the cationic Chitosan polymer is less than 1 nm. It was measured with a Nanotrac 180° backscattering heterodyne DLS instrument. The zeta potential of the agglomerates of around 100 nm was +59 mV. The concentration was 0.1% wt/vol. From this it is concluded that the polymer molecules have as well +59 mV.
This was confirmed by an anionic charge titration in the Particle Metrix StabiSizer® with a 0.01n PVS standard polymer solution. Measuring streaming potential, the StabiSizer® instrument is very sensitive on macromolecular ions, not on the few agglomerates.
The zero point titration of a 10 ml 1 % wt/vol Chitosan sample with 0.01 meq charge gave 1.18 ml of consumption, totaling to 118 meq / g sample, which is seen as high.
Conclusion
In applications where discrimination and high resolution is necessary, the ZetaView instrument gives reliable results without having to loose a lot of time with the optical alignment of the particles. Recently, a Zetrator instrument was developed to change the environment of the particles in a controlled way.
Dr. Hanno Wachernig
wachernig (at) particle-metrix.de