


Applications
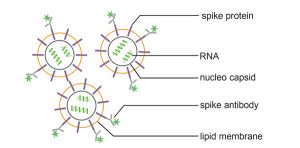
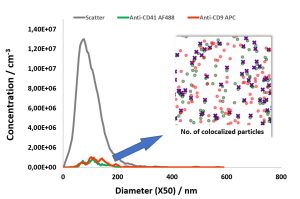
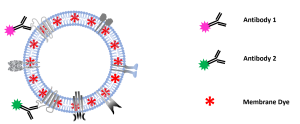
Colocalization-NTA of multi-stained platelet derived MSC-EV preparations
After successfully showing C-NTA of double-stained MSC-EVs in our previous study (https://bit.ly/43GG0Yk) and confirming
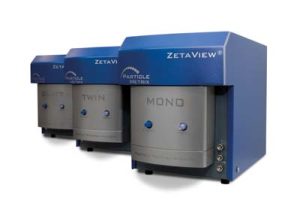
the results with image flow cytometry, this note describes C-NTA of multi-stained MSC-EVs using a PMX-430 QUATT NTA
system with four lasers.