NANO-flex 180° DLS nanoparticle sizing
180° heterodyne back scattering

Performance of 180° DLS
From the simple “heterodyne” geometry shown in fig. 1 SEVEN key performance features are derived. These are unique compared to conventional “homodyne” techniques.
- Shortest path in the sample
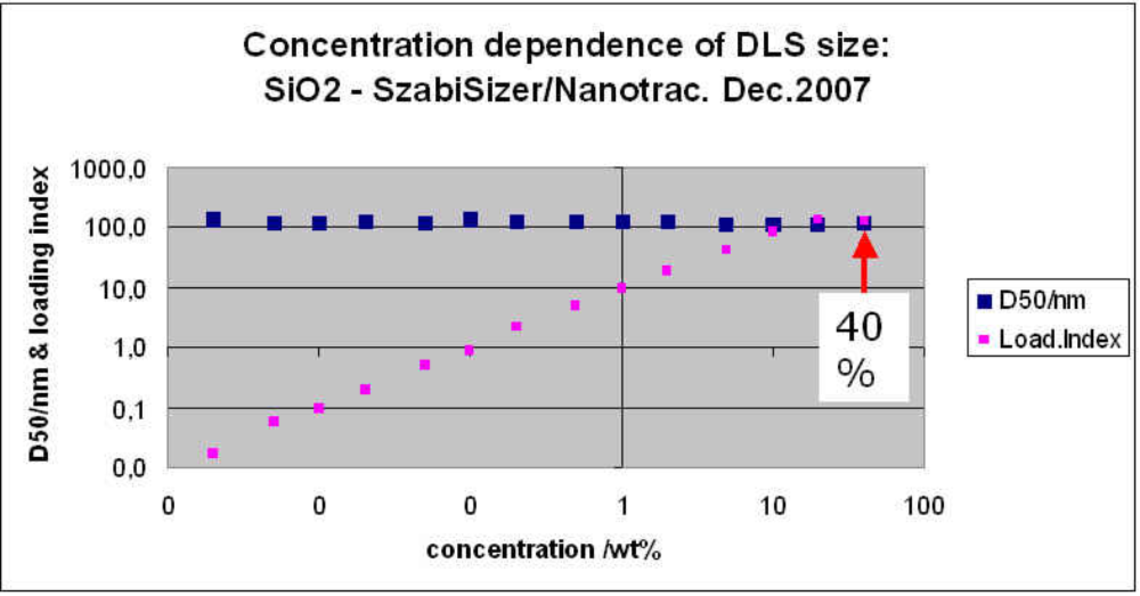
- Therefore highest concentration range – example see Fig. 6
- Concentration and size in one – see Fig. 9
- From transparent beverage to carbon black, all samples can be measured, provided the sample concentration is not too small for the small size end – see Fig. 5 - or not too high for the high size end
- Probe design offers highest flexibility
- 180° heterodyne scattering: Optical amplification of the scattering signal by admixing the laser reflection from the entrance window (sapphire). That guarantees high sensitivity for small particles in presence of big ones. Formula for the interfering signal at the detector see Fig. 2.
- High resolution AND High dynamic range in size: see result on a logarithmic scale in Fig 3. It allows a good resolution and a high dynamic range in size. Application examples demonstrate that.
Moreover the system offers 2 further differentiating features:
- Molecular weight AND dn/dc result from one single Debye plot analysis – see Fig. 10
- Mie smoothing by selection of spheric / irregular shape. Important for irregular particles in the Mie size range.
Heterodyne and homodyne set-up expressed mathematically
Displayed in a logarithmic frequency scale the contribution from different sizes to the detector signal looks quite simple (Fig. 3).


No confusion any more between “PCS” and “DLS”
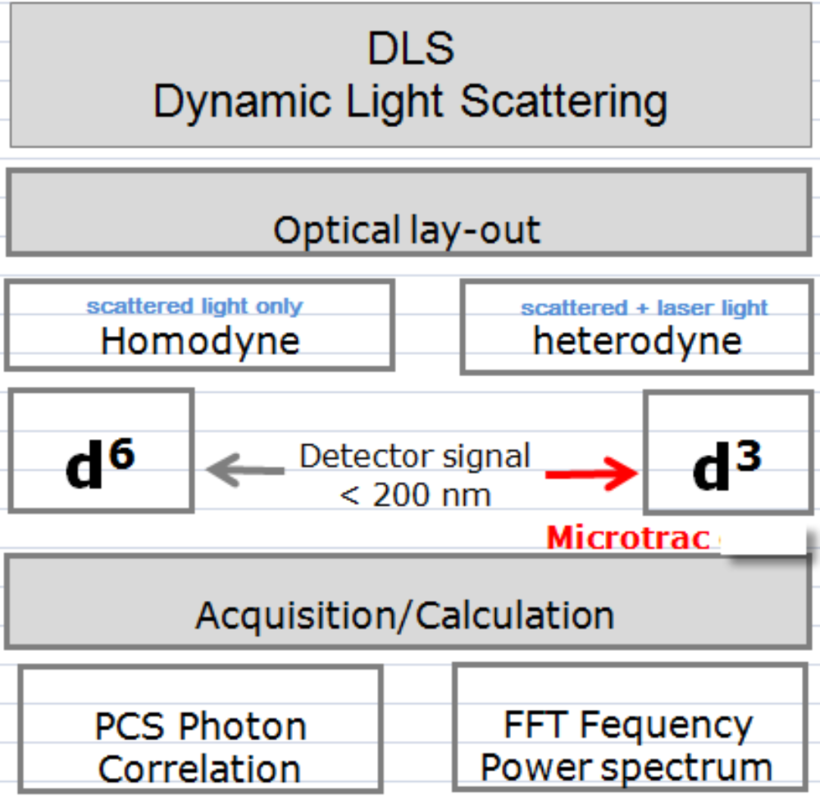
Many people take “PCS” as the general term for DLS. This is incorrect. The following graph should be a help in differentiating between DLS and PCS. “DLS” is the general term for the technique to do light scattering on a particle suspension / macromolecular solution and to evaluate the size distribution of the objects (nanoparticles or macromolecules) from their Brownian motion. The Brownian motion is represented by a fluctuating signal on a single detector, on which the scattered light waves (and admixed laser light in the heterodyne case) from all particles interfere with each other. “PCS” Photon Correlation Spectroscopy is one of the methods to deduce the particles size distribution from the fluctuating signal. It is based on correlating the signal in a time space. The FFT Fast Fourier Transformation does the same in the frequency space. Both methods can be transformed into each other and are therefore equivalent. However, there is a big difference in the optical setup of homodyne and heterodyne type. The advantages listed above are a consequence of that.
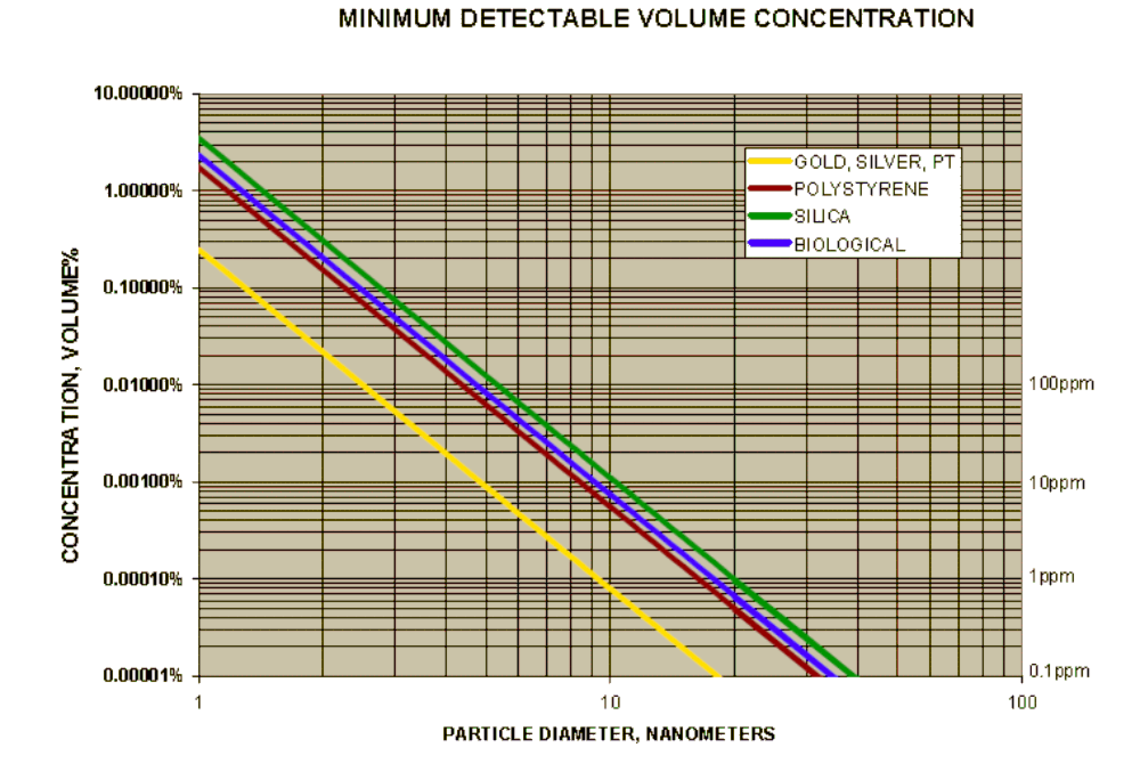
Sample concentration
There are detection limits in DLS: On the small size end it is the rapidly decreasing scattering intensity. For the 180° DLS realized in the Particle Metrix NANO-flex® the minimum concentration is given in figure 5. In the high size range, the scattering is comparably strong. A few particles in the high size range represent a statistically bad situation. Depending on the manufacturer and the applied software features, big particles are either sorted out by the software as “dust” or taken into account, whereby the statistical significance suffers. In the 180° DLS intensity mode both ends are seen, provided the sample concentration at each fraction of the size distribution allows it. Examples are shown in the application section of this exposé.

180° DLS of a mixture of one drop each of 100 nm and 200 nm Polystyrene Latex (Duke): The suspensions were a few months old. One drop of the mixture was placed on top of the probe of the NANO-flex. The size measurement was performed without data massaging. The result is presented in Fig 7.
High dynamic range
To detect small colloidal particles when some big agglomerates are around is very demanding for the DLS technique. Most samples , where the small size represents the majority contain some bigger particles. That situation is observed in beverages, proteins, as well as in metal oxide suspensions.


Simultaneous measurement of molecular weight AND dn/dc

Please note: With one measurement and one analysis you create a Debye plot AND get a result on the dn/dc and molecular weight.
August 2014
Dr. Hanno Wachernig, Particle Metrix